Configuring Prometheus integration
Published on March 16th, 2021At a Glance
| Prerequisites | |
| Considerations | |
| Supported Environments | ☐ Private Network via Broker ☐ Internet Accessible via IP Whitelist ☒ Cloud Hosted |
Introduction
In order to use the Prometheus plugin, Roadie needs access to the Prometheus HTTP API. At the moment your Prometheus instance needs to be accessible from the internet so Roadie is able to make requests towards it.
This page describes how to set up a proxy for your Roadie instance to contact Prometheus.
Proxy configuration
Step 1: Create new proxy entry to point to your Prometheus instance
You must be an admin to be able to set up proxies.
To configure the URL of your Prometheus instance, you need to create a proxy entry in your Roadie instance settings. You can find the proxy configuration at:
https://<tenant-name>.roadie.so/administration/settings/plugins/proxyThe Prometheus plugin uses the URL path /prometheus/api, so you need to set this as the path for your proxy. The target should be the URL of your Prometheus instance including the path to its API. You can also add custom headers to the request if your Prometheus instance requires specific authentication.
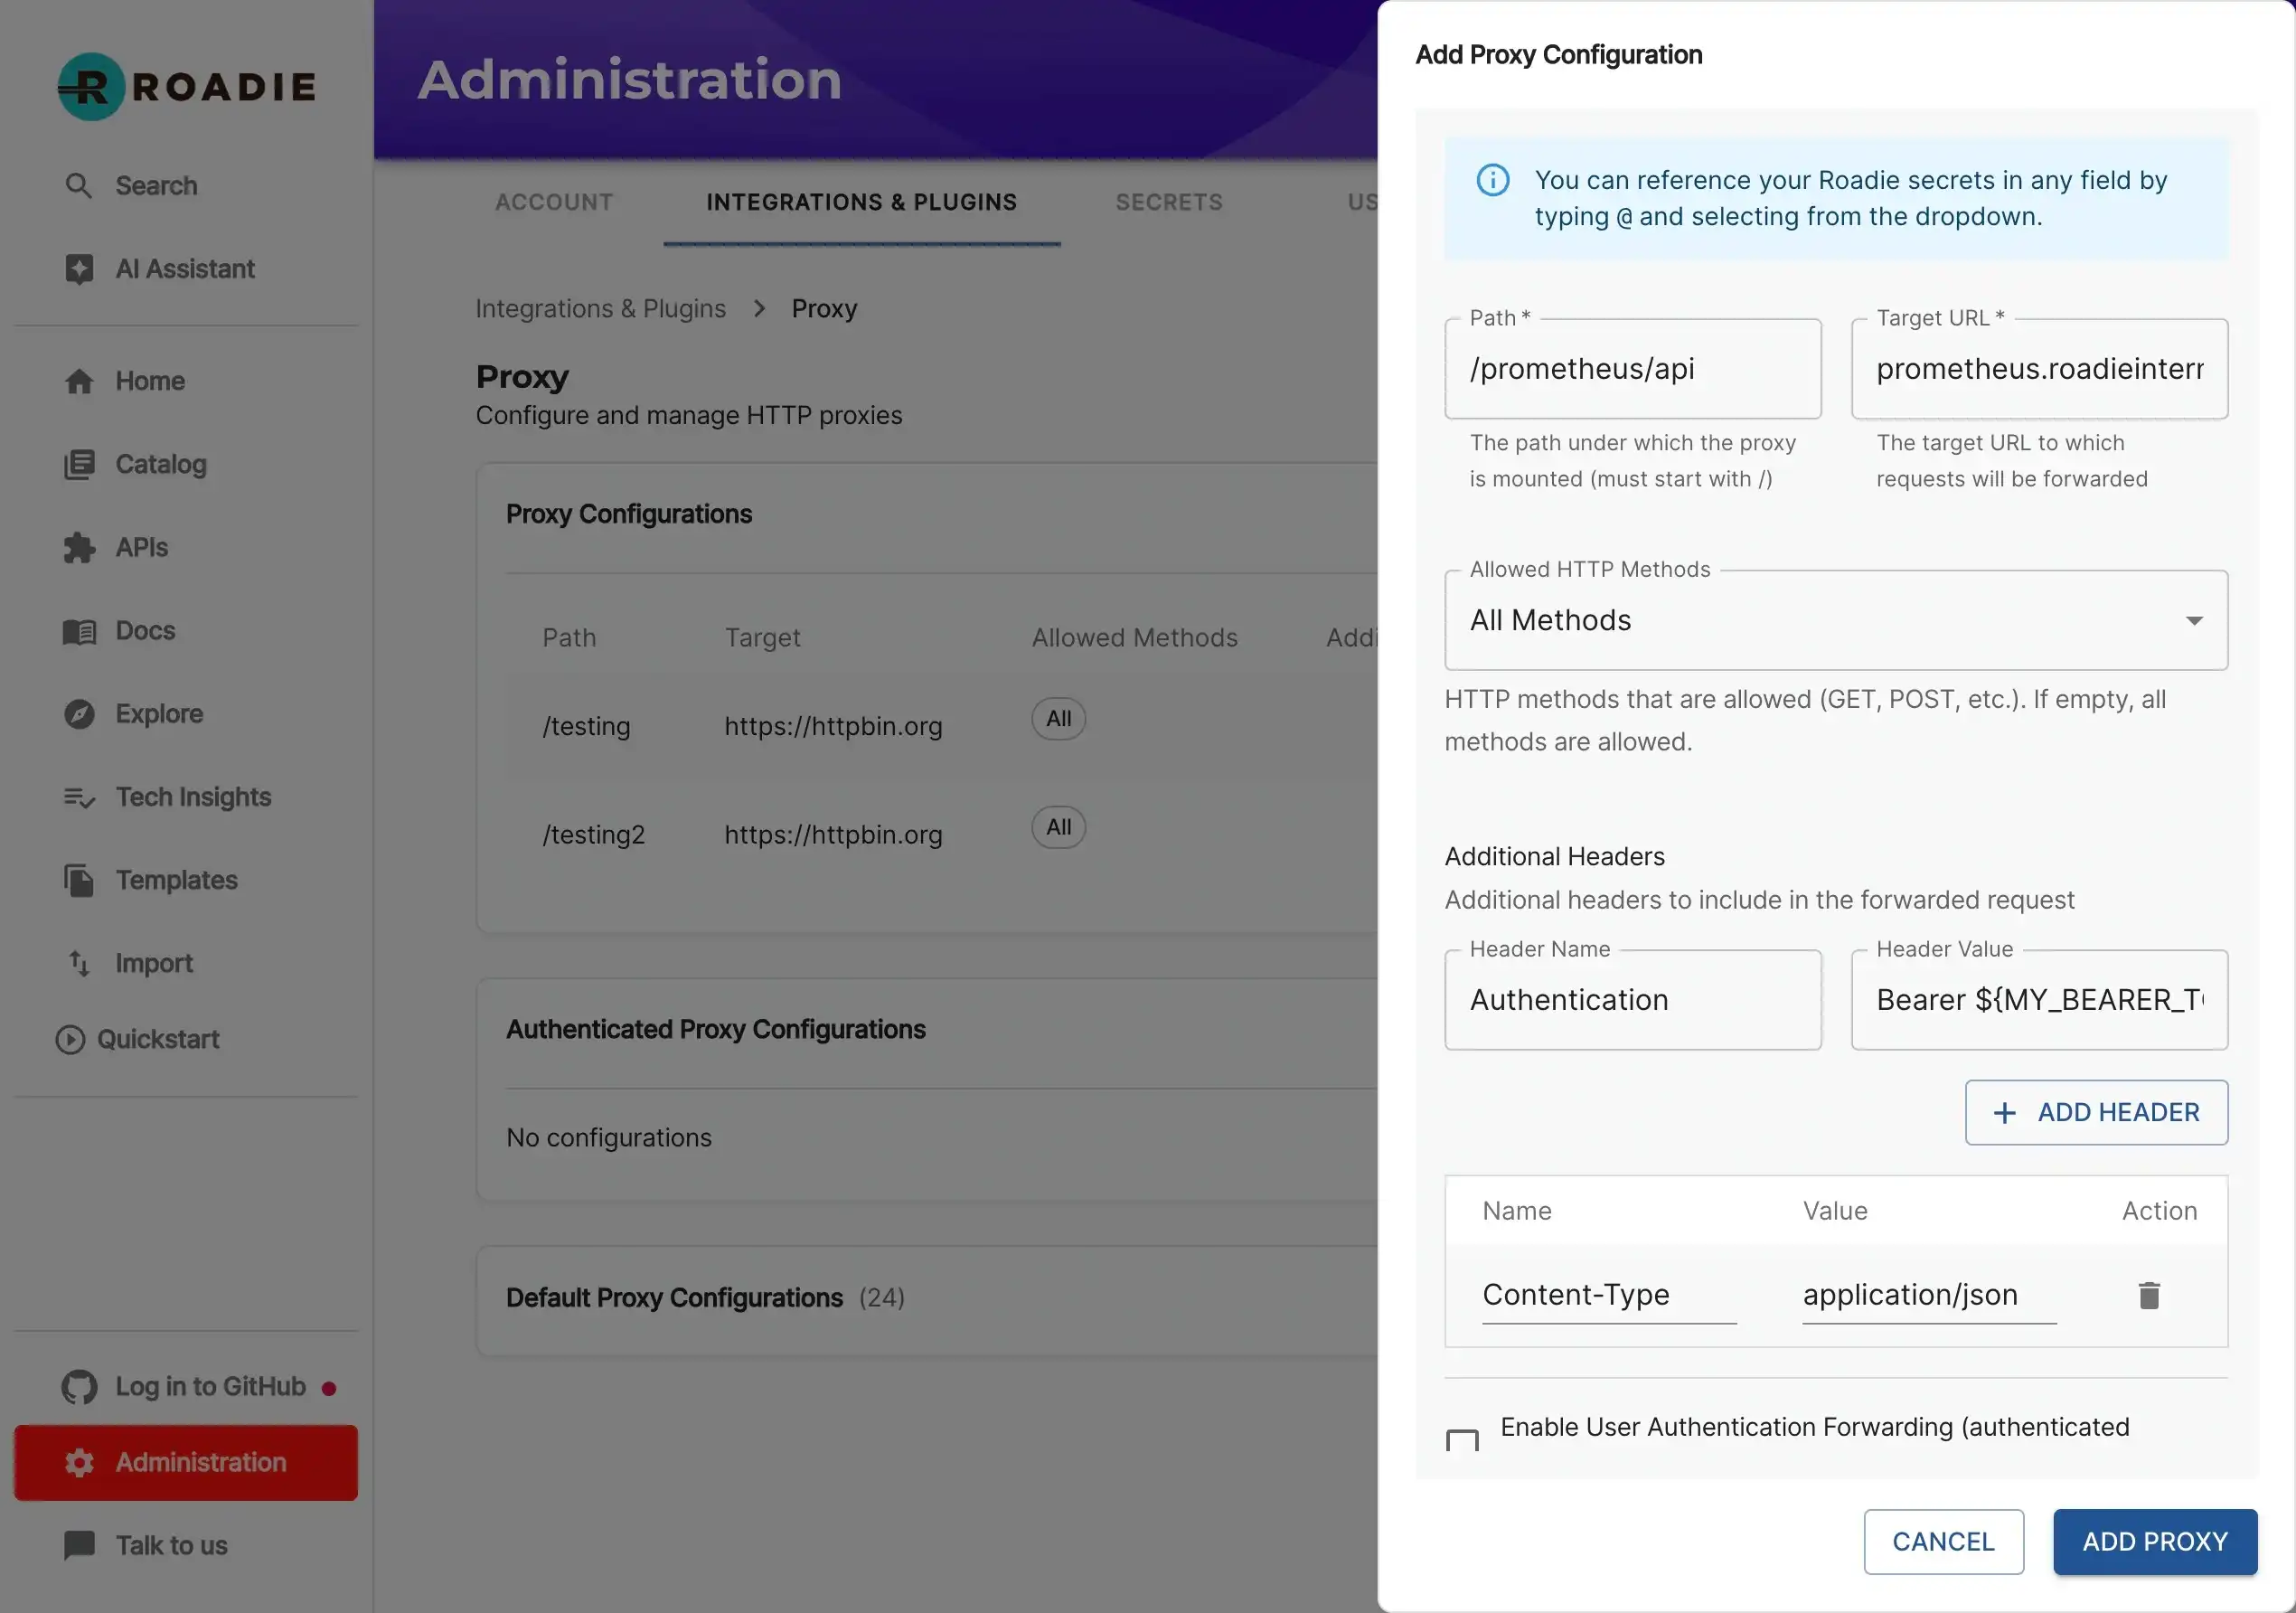
Authenticated Proxy Option
If you want to automatically forward the authentication headers used with Roadie to your Prometheus instance, you can enable the “Forward Authentication” option when creating your proxy. This will include the user’s authentication token in requests to your Prometheus instance.
To set up an authenticated proxy:
- Navigate to the proxy configuration page
- Click “Add Proxy”
- Enter the path (
/prometheus/api) and target URL - Check the “Forward Authentication” checkbox
- Add any additional headers if needed
- Click “Add Proxy”
- Click “Apply & Restart” to apply the changes
Step 2: Configure your entities with Prometheus annotations
The Prometheus plugin uses entity annotations to determine what data to display. There are two different annotations that can be used:
- Rule annotation to visualize Prometheus recording rules and queries
- Alert annotation to display Prometheus alerting rules in a table format.
Graphs
prometheus.io/rule
The ‘rule’ annotation expects a comma separated list of queries or recording rules and grouping dimension tuples. Dimension is optional and can be omitted which leads to the first label found from the returned data set to be used as the key to group items with.
The annotation supports individual metrics, promQL queries or references to a name of a recording rule. For complex queries a recording rule is the preferred option, since annotation parsing prevents the usage of characters , and | in queries.
Example annotation:
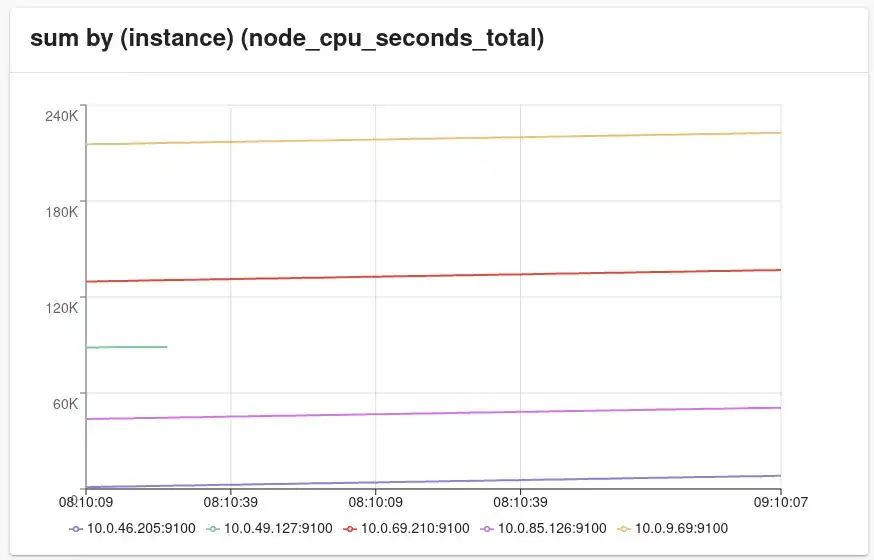
prometheus.io/rule: memUsage|component,node_memory_active_bytes|instance,sum by (instance) (node_cpu_seconds_total)
Produces the following graphs:
-
memUsage|component(grouping by component, otherwise__name__would be the first item on this saved rule. Showed here as an area graph)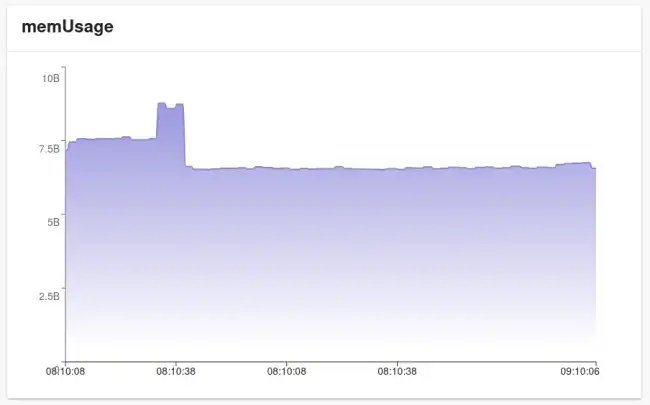
-
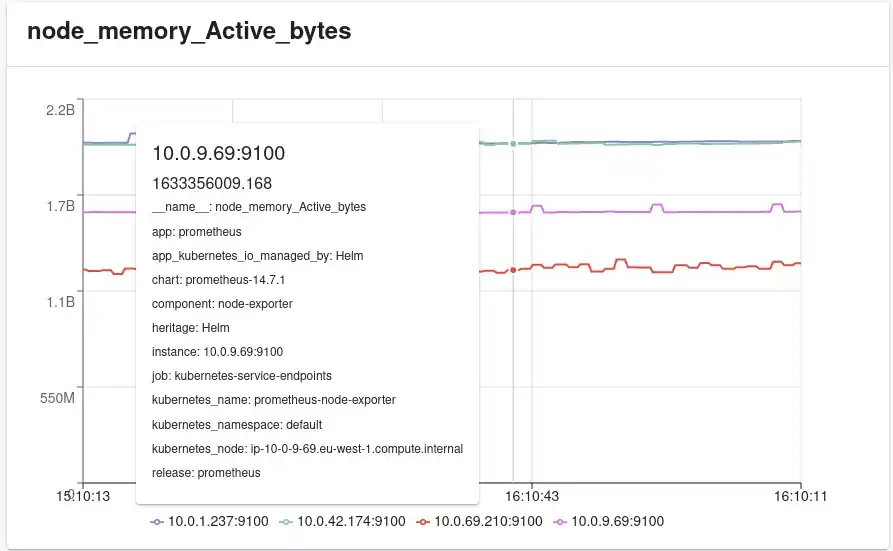
node_memory_active_bytes|instance(grouping byinstance, image shows extra data on hover over a line.)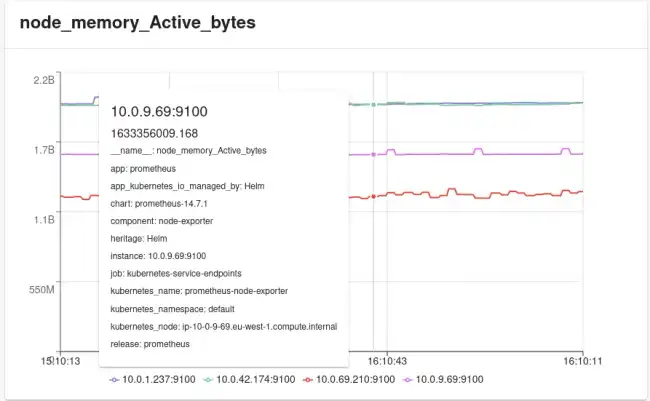
-
sum by (instance) (node_cpu_seconds_total)(instanceis the grouper label defined in the query —> it is returned on the result set as the first label name, and is therefore used to group data with.)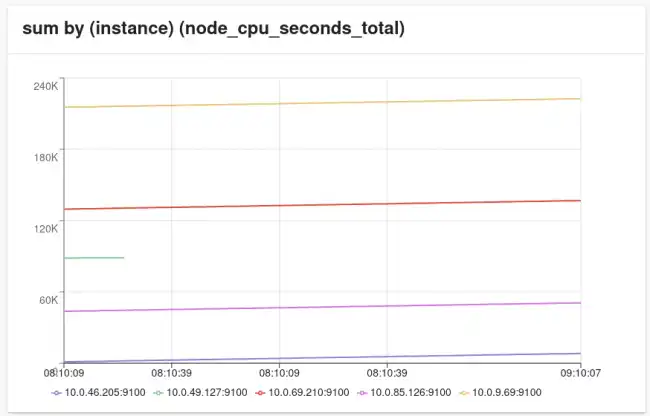

Alerts
prometheus.io/alert
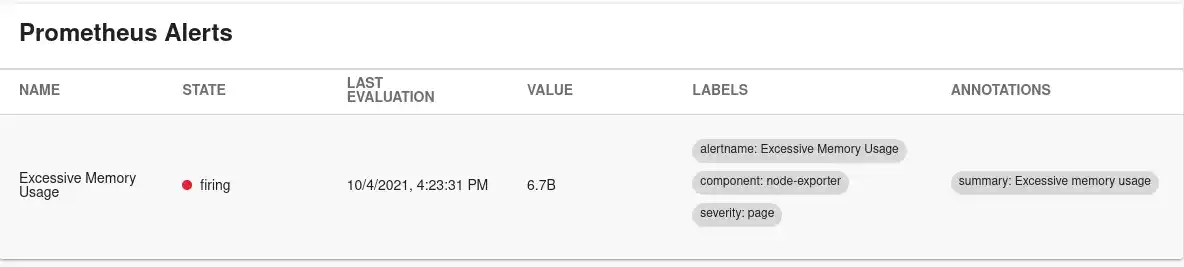
The ‘alert’ annotation expects a comma separated list of predefined alert names from the Prometheus server. These are iterated and displayed in a table, displaying state, value, labels, evaluation time and annotations. To display all alerts configured in Prometheus a magic annotation prometheus.io/alert: all can be used.
Example annotation:
prometheus.io/alert: 'Excessive Memory Usage'
Produces the following table.
Step 3: Configure UI components for your Roadie instance
You must be an admin to edit the UI layout. You can follow this guide to add new Cards and Tabs into your Roadie instance. There are 3 different components available for you to configure.
EntityPrometheusContent (Tab)
The EntityPrometheusContent is a tab that can be placed on the entity pages. It requires the prometheus.io/rule annotation to be set on the entity.
The tab has three optional parameters: range, step and graphType. e.g.
The follow options will give a line graph showing the last hour of data.
{
  "step": 28,
  "range": {
    "hours": 1
  },
  "graphType": "line"
}| Option | Description | Schema | Default | Example |
|---|---|---|---|---|
| step (optional) | The graph step | number |
14 |
28 |
| range (optional) | The range of the graph | { hours?: number, minutes?: number } |
{ "hours": 1 } |
{ "hours": 2 } |
| graphType (optional) | Type of graph to use | 'line' | 'area' |
line |
line |
EntityPrometheusAlertCard (Card)
The EntityPrometheusAlertCard is a card that can be placed on the entity pages and shows a list of alerts from prometheus. This card requires that the prometheus.io/alert annotation is set on the entity.
EntityPrometheusGraphCard (Card)
The EntityPrometheusGraphCard is a card that can be placed on the entity pages. The card can be configured to use an annotation on the entity prometheus.io/rule or a query configured on the card properties to show a graph from prometheus.
The tab has five optional parameters: range, step, graphType, query, and enableQueryTemplating. e.g.
The follow options will give a line graph showing the last hour of data.
{
  "step": 28,
  "range": {
    "hours": 1
  },
  "graphType": "line"
}| Option | Description | Schema | Default | Example |
|---|---|---|---|---|
| step (optional) | The graph step | number |
14 |
28 |
| range (optional) | The range of the graph | { hours?: number, minutes?: number } |
{ "hours": 1 } |
{ "hours": 2 } |
| graphType (optional) | Type of graph to use | 'line' | 'area' |
line |
line |
| query (optional) | The query to use | string |
undefined |
max by (host) (my_metric_name) |
| enableQueryTemplating (optional) | To enable query templating from entity data | boolean |
false |
true |
Query templating allows a query to be written that includes data from an entity. e.g. you can use the following options:
{
  "enableQueryTemplating": true,
  "query": "max by (host) (my_metric{kuberenetes_namespace=\"{{ metadata.name }}\"})"
}